Blood Sugar Charts / Logs
A blood sugar chart is used to record data from a device that monitors the amount of sugar (or glucose) that is present in the blood. Tracking blood glucose levels is critical for individuals who are suffering from pre-diabetes or diabetes, as it allows them to manage it effectively. The chart helps them to record the data over time to see how their levels have increased, decreased, or stayed the same.
Doctors can also use this information at check-ups to prescribe a plan or medication if it is needed. The charts contain multiple categories to enter blood glucose levels before and after each meal. They have fillable sections for comments about medications, food or drink intake, exercise, and other key components of health, as well.
Free Printable Blood Sugar Charts
How to Chart Blood Sugar Levels
To chart blood sugar levels, enter data from a glucose meter before and after meals. Fill in the remaining sections (i.e. insulin, food, drink, etc.) for that meal, as well. Each chart varies in its structure and specificity; however, many of them include ideal blood glucose ranges and tips for lowering blood sugar. Keep in mind that it is always important to talk to a physician prior to using these charts.
It is important to track blood sugar levels for a variety of reasons. In short, cells are not able to use sugar when someone has pre-diabetes or diabetes. When sugar cannot enter the cells, it collects in the bloodstream. The body then becomes starved of energy. As a result, major organs are at risk for damage. Other life-threatening conditions, like a heart attack or stroke, can occur, as well. By monitoring levels regularly, the patient is less likely to suffer from these illnesses.
What Does a Normal Blood Sugar Chart Look Like?
A blood sugar reading must be at or under a certain number to fall into the normal category. Blood sugar changes throughout the day, so the ideal range varies. For example, fasting for 8 hours will produce a different reading than 1-2 hours after a meal. Diabetes ranges are also separate from individuals who do not have this illness. The chart below makes it easier to understand these variations by providing target levels. Note that these numbers are merely targets and do not count as medical advice. Always talk with a doctor and follow their instructions when tracking blood glucose.
| Normal | Pre-Diabetes | Diabetes | |
| Fasting | ≤ 99 mg/dL | 100-125 mg/dL | ≥ 126 mg/dL |
| Post-Meal | ≤ 140 mg/dL | 140-199 mg/dL | ≥ 200 mg/dL |
| HbA1C | < 5.7% | 5.7-6.4% | ≥ 6.5% |
Blood Sugar Tests
Each type of test (i.e. fasting, after a meal, HBA1C) includes a step-by-step procedure to ensure the best accuracy. They also assess separate functions in the body, which can help a doctor make the right diagnosis and give the patient a clearer view of their data.
- Fasting: This test measures the amount of sugar that is present in the blood when an individual has not eaten for a set period of time. Most commonly, fasting happens overnight or over an eight-hour period. When a doctor orders this type of reading, it is likely to check for diabetes mellitus. A normal reading is considered 99 mg/dL or below, whereas a person with diabetes will have a blood sugar reading of 126 mg/dL or more. Individuals who fall in between the normal and diabetes ranges (i.e. 100-125 mg/dL) are often considered pre-diabetic.
- Post-Meal: After eating, blood sugar naturally spikes and then falls after the sugar absorbs into the cells. It typically takes about 1-3 hours for levels to regulate, and that is when many people decide to take their next reading. Healthy individuals will have a blood glucose reading at 140 mg/dL or below. Pre-diabetics will fall between 140-199 mg/dL, and people with diabetes will have a level of 200 mg/dL or more.
- HbA1C: Sugar naturally attaches to hemoglobin, which is a protein that is found in red blood cells. Individuals who have consistently high blood sugar will have more sugar particles on their hemoglobin. The A1C test counts the amount of glucose on the cells and displays that number as a percentage. It is important as it gives doctors an idea of the patient’s blood glucose over the past 3 months. Ideally, A1C should be below 5.7%.
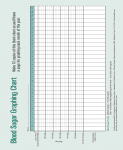
How to Read a Blood Sugar Chart
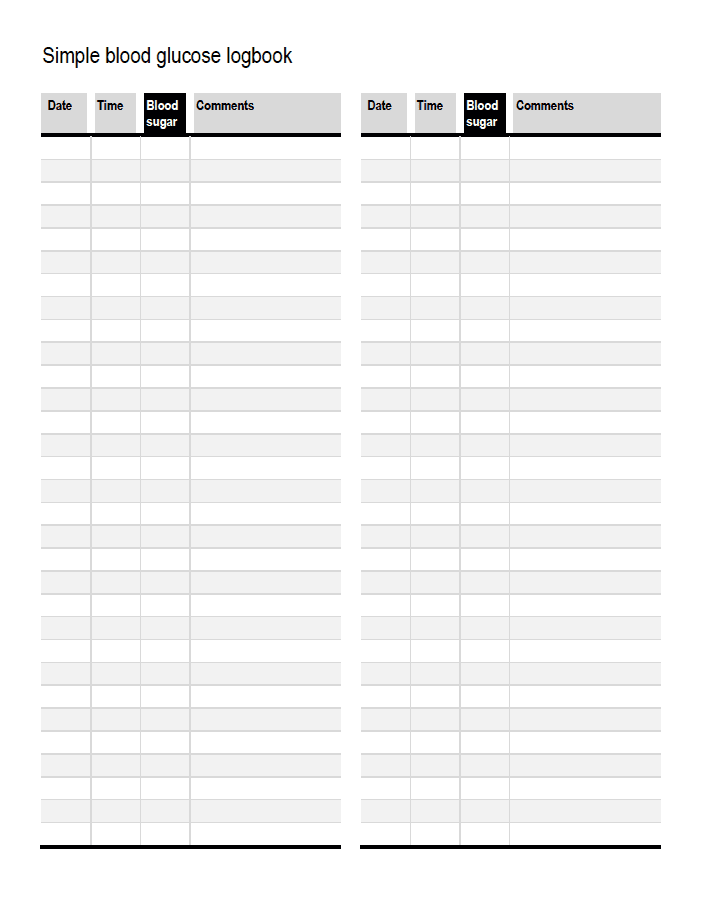
To read a blood sugar chart locate the blood glucose value that is stated for each meal. Each template has a unique layout; however, many of them have a standard structure. Commonly, the individual navigates to the specified day (Monday through Sunday) and then the desired meal (Breakfast, Lunch, Dinner, Snacks, etc). Each meal has two readings – one before eating and one 1-3 hours after eating. The individual can also include additional information with each reading, such as the time, exercise (if applicable), or other relevant notes.
After pulling the data, analyze it based upon the targets or doctor-recommended chart values. If it does not fall into the normal range, it may be a sign of hypoglycemia or hyperglycemia, but it is best to consult with a physician in these cases. Overall, blood glucose templates are helpful for doctors and patients to identify trends and patterns over time. They also help individuals monitor the effects of lifestyle choices on symptoms and medication dosages.